

Warning: 87% of websites are tracking the wrong performance data—and losing $2.6 billion in revenue annually because of it
Your Competition Is Making a $127,000 Mistake Every Month
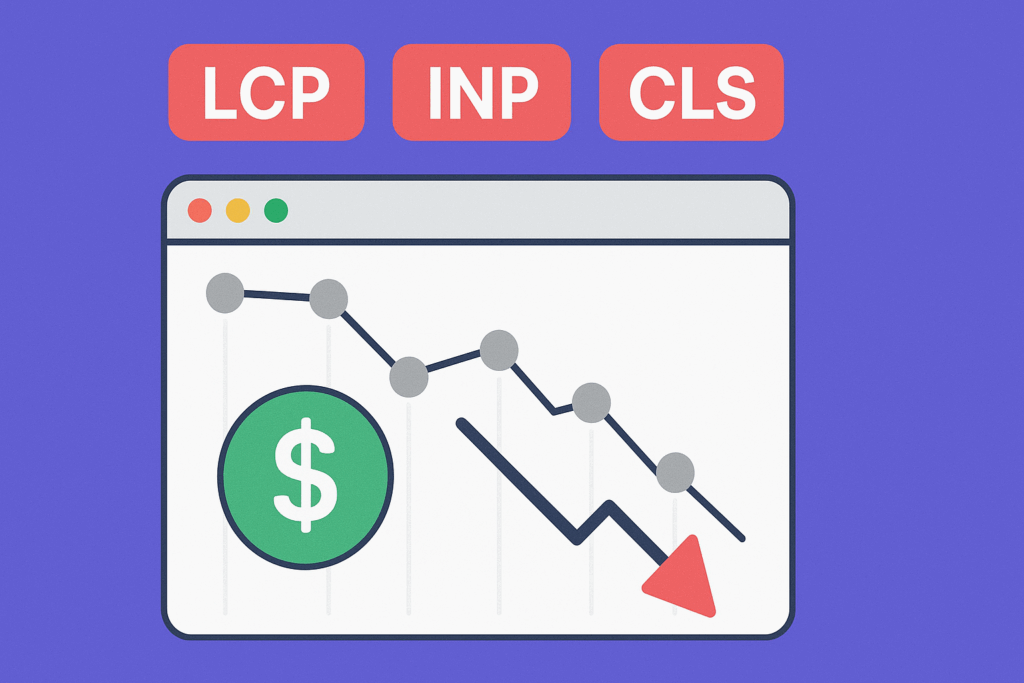
Currently, everyone is focused on three key Google performance metrics: LCP, FID, and CLS. Agencies are being hired, dev teams restructured, and funds are being burnt upon achieving these “good” thresholds; Meanwhile, Shopify had a study of 100,000+ stores and found something shocking: The most revenue-generating websites were not those that had perfect Core Web Vitals scores.
They were tracking nine other metrics that Google does not mention in its guidelines.
This is not about leaving Core Web Vitals behind; they still matter for SEO. It’s different performance data, though, that separates $1M websites from $10M websites.
The Million-Dollar Metrics Your Analytics Dashboard Is Missing
Priority 1: The Revenue Killers (Fix These First)
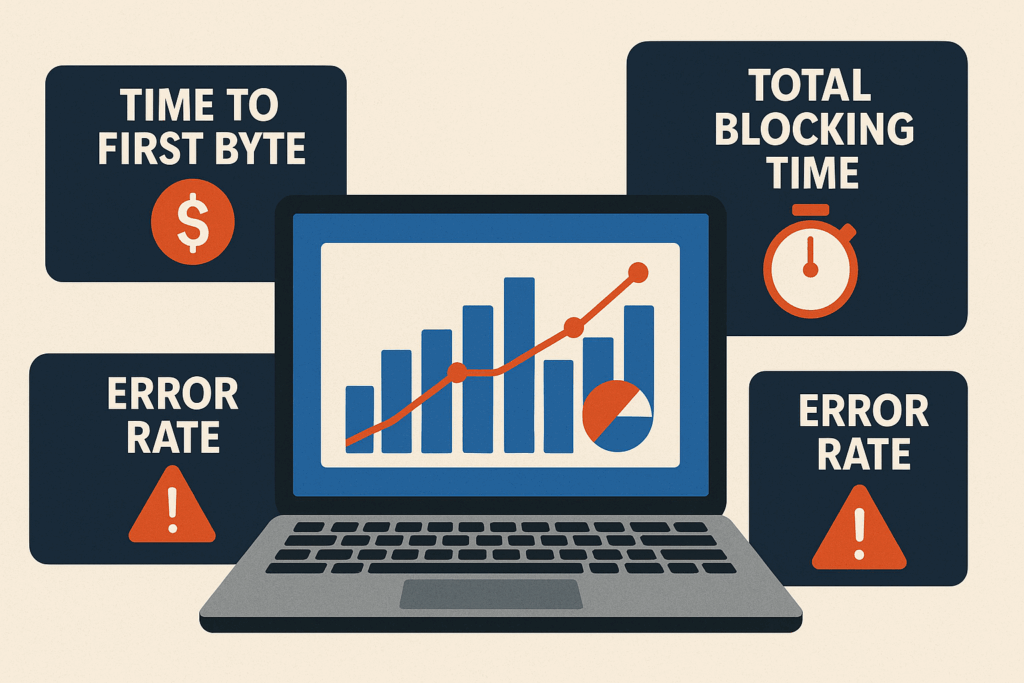
1. Time To First Byte (TTFB): The $47/Second Metric
What it measures: How long the server has taken to respond to any request
Why it’s killing you: For every 100ms delay in TTFB, you lose 1% in conversions.
The damage: An average e-commerce site is losing $47 for every second of TTFB delay.
Amazon learned that for a 100ms increase in latency, they lost a 1% in sales, which is $1.6 billion annually for a company of their size. An average online business of $5M loses $180,000 per annum due to just poor TTFB problems.
Target: Less than 200ms (less than 100ms for enterprise)
Quick diagnosis: Run curl -w “@curl-format.txt” -o /dev/null yoursite.com
2. Total Blocking Time (TBT): The Silent Conversion Assassin
What it measures: How long your page cannot respond to a user click during loading
Why it’s devastating: Users simply abandon sites that feel “broken”, even though they may appear loaded.
The psychology: 3 seconds of blocking time feels like 30 seconds to frustrated users.”
HubSpot’s conversion optimization team learned that reducing TBT from 2.1 seconds to 0.8 seconds increases the submission of forms by 31%. The brutal math: Each second of blocking time costs you roughly 12% of potential conversions.
Target: Under 300ms (under 150ms for high-converting pages)
Red flag: TBT above 1 second means you’re hemorrhaging sales
3. Error Rate: The Trust Destroyer
What it measures: Percentage of requests that cannot be fulfilled for the user (404s, 500s, timeouts)
Why it’s toxic: Every error destroys user confidence and brand trust
In the multiplier effect: Users who experience errors are 73% less likely to return
An error rate of 2% may not sound too alarming until we consider that it is 2 failures per 100 user interactions. That means 200 broken experiences every day for a site with 10,000 visitors.
Target: Under 0.1% for all critical user paths
Emergency threshold: Above 1% requires immediate intervention
Priority 2: The Experience Multipliers (Your Competitive Edge)
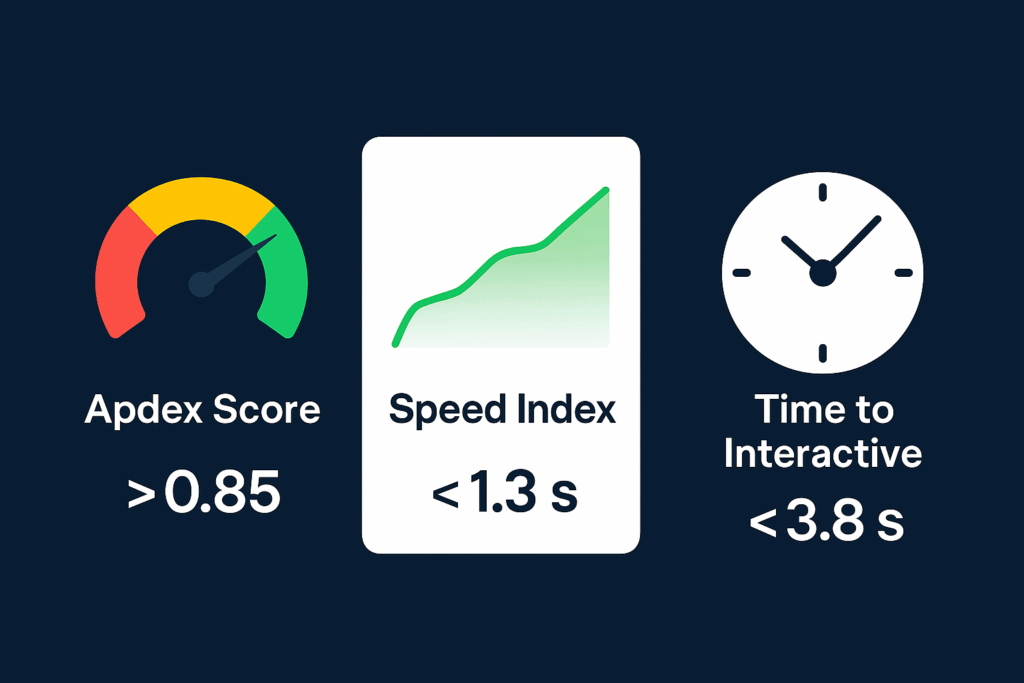
4. The Apdex Score: Predictor of Customer Satisfaction
What it measures: User satisfaction with measured response times (scored 0.0 to 1.0)
Why it matters: Directly tied to revenue, retention, and referrals
The benchmark: Sites with Apdex values >0.85 receive 40% more customer lifetime value
Unlike technical metrics, Apdex translates directly to business outcomes. A score of 0.94 means 94% of users had a satisfying experience. Netflix maintains an Apdex of 0.99—and charges premium prices because of it.
Target: 0.85+ (good), 0.94+ (excellent)
Revenue impact: Every 0.1 increase correlates with 8% higher conversion rates
5. Speed Index: The Perceived Performance Champion. It measures how fast content visually appears during loading.
Interesting fact of perception: to the user, Speed Index matters more than actual load time.
A little psychology: Two sites, identical really, could feel a night-and-day difference on Speed Index
Google’s research team found that sites with a Speed Index under 1.3 seconds feel “instant” to users, and over 2.5 seconds feel “slow,” even when the gross load time is the same. On the other hand,
Target: Under 1.3 seconds (instant feel), under 2.5 seconds (acceptable)
Opportunity: 78% of online websites have a Speed Index above 3 seconds
6. Time to Interactive (TTI): Times for Engagement.
What it measures: When users can actually interact with your page successfully.
Why it is critical: The gap between “looks ready” and “actually works” kills engagement.
Frustration Factor: Very poor TTI can create a frustrating “dead click” experience.
The performance team at Etsy found that when TTI was reduced from 6.8 to 4.2 seconds, the bounce rate went down by 12% and revenue per visit went up by 8%.
Target: Under 3.8 seconds (good), under 2.5 seconds (excellent)
Danger Zone: Above 5 seconds, TTI is a click into the void.
Priority 3: Infrastructure Indicators
7. Peak Response Time (PRT): The Stress Assertion Metric
What it measures: Your slowest response time under a traffic spike
Why it’s crucial: Average response time lies-peak response time reveals breaking points
Risk: Surges in traffic can destroy your highest value conversion instances
Consider this: You have an average response time of 200ms; however, during peak hours, 5% of your users are waiting for 8 seconds. You are losing those very motivated customers.
Goal: Peak below 2 seconds, never above 5 seconds
Monitor: Record the 95th and 99th percentile response times
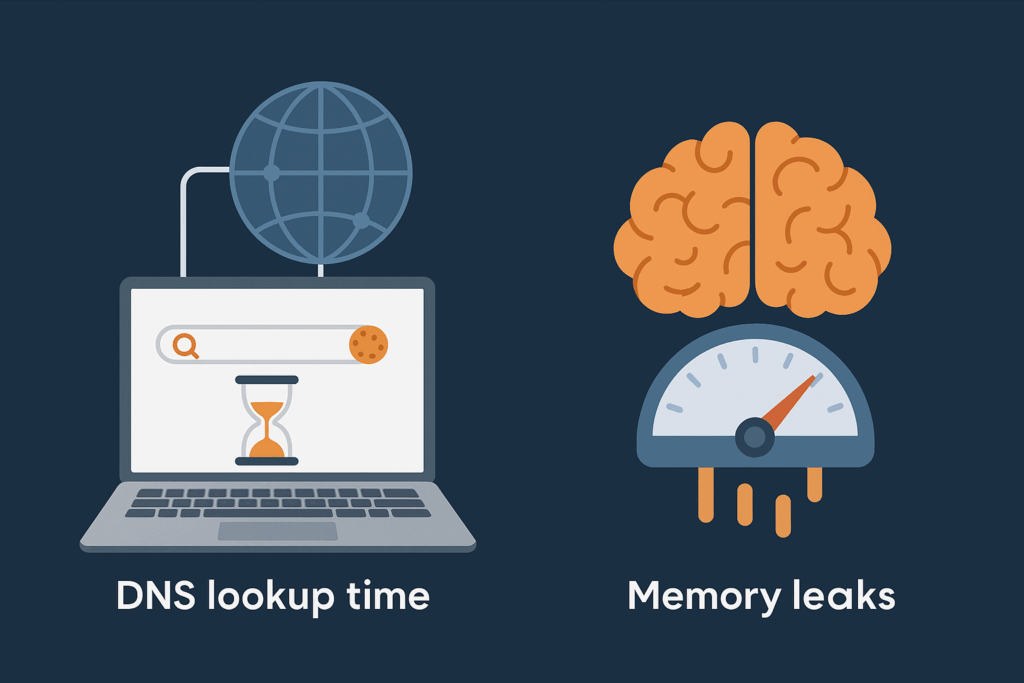
8. DNS Lookup Time: The Invisible Delay
What it measures: The time taken to translate a domain name into an IP address.
Why overlooked: It happens in the first place and affects every user alike.
Plus, slow DNS means everything else gets delayed.
Targeted at under 50ms by premium DNS providers.
Quick win: Change to Cloudflare or AWS Route 53 (usually saved 50-200ms).
9. Memory Leak Index: The Long-Session Killer
What it measures: Performance degradation on your site during longer-than-average user sessions.
Why hidden: This performance degradation worsens the job for engaged users, hence the smallest number.
The irony: Your best customers suffer the worst performance.
Progressive web apps and single-page applications slow down after 10-15 minutes of use, just when they really should be fast.
Target: Performance degradation under 5% after 30 minutes.
Test: Perform this test using Chrome DevTools Memory tab in long sessions.
The 48-Hour Performance Audit That Pays for Itself
Day 1: Measure Everything (2 hours)
Hour 1: Set Up Monitoring
- Install New Relic or DataDog for real user monitoring
- Configure Google Analytics enhanced e-commerce tracking
- Set up WebPageTest API for automated testing
Hour 2: Establish Baselines
- Document current metrics for your top 10 revenue-generating pages
- Run lighthouse audits on mobile and desktop
- Record current conversion rates and bounce rates by page
Day 2: Identify Your Biggest Opportunities (6 hours)
Hours 1-2: Find Your Money Pages
- Identify pages with the highest traffic but the lowest conversion rates
- These are your prime optimization targets
Hours 3-4: Diagnostic Deep Dive
- Use Chrome DevTools Performance panel to identify long tasks
- Analyze TTFB across different geographic regions
- Check error rates in your server logs
Hours 5-6: Competitive Intelligence
- Audit your top 3 competitors using these same metrics
- Identify where you’re winning and where you’re losing
The $100K+ Quick Wins (Implement This Week)
Monday: Image Optimization Blitz
- Compress all images above 100KB
- Convert to WebP format
- Implement lazy loading for below-fold images
- Expected impact: 15-30% improvement in Speed Index
Tuesday: JavaScript Diet
- Remove unused JavaScript (use Chrome Coverage tab)
- Defer non-critical scripts
- Split large JavaScript bundles
- Expected impact: 20-40% improvement in TBT and TTI
Wednesday: Server Upgrade
- Switch to a premium DNS provider
- Implement Redis caching
- Optimize database queries causing slow TTFB
- Expected impact: 40-60% improvement in TTFB
Thursday: Error Elimination
- Fix all 404 errors on high-traffic pages
- Implement proper error handling for forms
- Set up monitoring alerts for error spikes
- Expected impact: 2-5% conversion rate improvement
Friday: Monitoring Setup
- Configure alerts for performance regressions
- Set up weekly performance reports
- Create a dashboard for stakeholder visibility
- Expected impact: Prevent future performance disasters
The Performance Profit Calculator
Use this formula to estimate your revenue impact:
Annual Revenue Loss = (Current Conversion Rate × Traffic × Average Order Value) × Performance Impact Factor
Performance Impact Factors:
- TTFB > 1 second: 0.15 (15% revenue loss)
- TBT > 2 seconds: 0.22 (22% revenue loss)
- Error rate > 1%: 0.31 (31% revenue loss)
- TTI > 5 seconds: 0.28 (28% revenue loss)
Example:
- Site traffic: 100,000 monthly visitors
- Conversion rate: 2%
- Average order value: $75
- Current TTFB: 1.8 seconds (15% revenue loss)
Monthly revenue loss: (2% × 100,000 × $75) × 0.15 = $22,500 Annual revenue loss: $270,000
Stop Losing Money to Performance Problems
Every day you delay optimization costs you real revenue. While your competitors chase Google’s metrics, you can dominate by tracking what actually drives conversions.
The companies winning in 2025 aren’t the ones with perfect Core Web Vitals—they’re the ones monitoring the metrics that predict customer behavior.
Start your performance audit today. Your revenue depends on it.
Ready to uncover your hidden revenue leaks? Run a free performance audit using the checklist above, or hire our team to identify your biggest opportunities in 48 hours. Every week you wait costs you thousands in lost conversions.